

Sensor Accuracy vs Resolution: How to Compare Specs Before Approval
Accuracy and resolution answer different buying questions. Accuracy is closeness to a reference; resolution is the smallest input change that produces a distinguishable indication. For an absolute limit, qualify the complete error and uncertainty under stated conditions. For small-change detection, qualify noise, repeatability, bandwidth and response time before approving a part or substitute.
A fine display increment can still hide bias, drift or installation error. A low error limit can still miss a fast event. The correct specification depends on the decision your measurement must support.

What Is the Difference Between Sensor Accuracy and Resolution?
Sensor accuracy describes closeness to the quantity being measured, while resolution concerns the smallest change that can be distinguished. The VIM treats accuracy as a qualitative concept; datasheets often use the word for numerical error limits. For a purchase, read the exact limit, basis and conditions rather than treating either term as a universal score.
Swipe horizontally to compare the decision factors.
| Your decision | Prioritize | Evidence to request | Stop approval when... |
|---|---|---|---|
| Is an absolute limit crossed? | Error limit and complete measurement uncertainty | Maximum/typical basis, operating range, reference uncertainty and system error budget | Only display resolution or a typical headline is supplied. |
| Can a small change be detected? | Noise, repeatability, bandwidth and response time | Repeated controlled steps, filter settings, detection criterion and false-detection results | Noise or lag is larger than the required change at the required time. |
| Will an ADC or display preserve useful detail? | Signal swing, sensitivity, noise-free bits and scaling | Input span, transfer function, ENOB/noise data and clipping limits | The calculation uses nominal bits only or ignores unused input span. |
| Can a substitute part be approved? | Same error basis, range, conditions and complete chain | Exact manufacturer P/N, datasheet revision, transfer function and qualification test plan | Percentages, test conditions or included error terms do not match. |
Terminology note: the International Vocabulary of Metrology (VIM) treats accuracy as a qualitative concept, not a numerical quantity. Datasheets commonly use the heading “accuracy” for numerical error limits. In practice, test readings against a reference with known uncertainty. The VIM definition of resolution also makes clear that noise and the value being measured can affect distinguishable changes.
Swipe horizontally to compare all columns.
| Term | Question it answers | What to ask for | What it does not prove |
|---|---|---|---|
| Accuracy / error limit | How far can the reading be from a reference value? | A numerical limit, its basis and all applicable conditions. | That tiny changes can be detected quickly. |
| Resolution | What is the smallest distinguishable change? | Whether the value means display increment, code increment or tested change detection. | That offset, drift or scale error is small. |
| Repeatability | How closely do repeated readings agree under the same specified conditions? | The statistic, sample count, duration, filtering and environment. | That the repeated readings are correct. |
| Sensitivity | How much does the output change per unit of input? | The transfer slope, such as V/bar or mV/°C. | That amplifying the output removes input-referred noise or bias. |
Precision concerns agreement among repeated measurements under stated conditions; repeatability is precision under repeatability conditions. Sensitivity is a different property: the output-to-input change ratio.
Can a Sensor Repeat Well and Still Be Wrong?
Yes. Repeatability shows how closely readings agree under stated repeatability conditions; it does not prove closeness to a reference. Imagine checking two temperature sensors against a stable reference indicating 25.00 °C. The following numbers are an illustrative example, not measured product data.
25.00 °C
0.01 °C steps
0.1 °C steps
The useful conclusion is narrow: A shows a consistent positive difference at this test point. B is closer in this one comparison. We have not established B's repeatability, either sensor's full-range performance, or whether the difference remains the same at another temperature.
That distinction matters on a production line. A stable but biased sensor may be useful for tracking small relative changes after proper characterization, yet unsuitable for deciding whether an absolute temperature limit has been crossed.
Which Sensor Specifications Should You Compare Together?
Compare output increment, accuracy/error limit, repeatability, response time and operating conditions as separate fields. The TMP117 and SHT45 examples below are published manufacturer data, not YURUNOX test results. They show why a small code step or a typical accuracy headline cannot stand in for the complete specification.
TMP117: a small digital step is not the accuracy limit
- Temperature code increment
- 0.0078125 °C
- Specified error limits, −20 to 50 °C
- ±0.1 °C
TI lists these separately in the TMP117 datasheet. The cited error limits apply with eight averages, a 1 Hz conversion cycle, and the stated supply and I²C input conditions; for the DRV package, the thermal pad is unsoldered.
Selection consequence: the fine temperature increment helps describe changes in the digital output. It does not turn the device into a ±0.0078125 °C thermometer, and the component specification is not automatically the accuracy of a complete probe or enclosure.
Source: TI TMP117 datasheet, Rev. D, section 6.5. Check the ordering variant and test conditions for your design.
SHT45: resolution, repeatability and accuracy coexist
The SHT4x datasheet lists 0.01 %RH ADC resolution, 0.08 %RH repeatability in high mode, and a typical ±1.0 %RH accuracy figure for SHT45. These are not three ways to state the same performance.
The repeatability figure is three times the standard deviation of consecutive measurements, at 25 °C and 50 %RH. The accuracy curves give humidity-dependent typical and maximum values; the typical headline is not a maximum guarantee across every condition.
Selection consequence: a 0.01 %RH output increment does not establish 0.01 %RH change detection. Compare the chosen repeatability mode and the accuracy curve at your working humidity and temperature. Here, %RH denotes relative-humidity percentage points, not a percentage of the displayed reading.
Source: Sensirion SHT4x datasheet, version 7.3, Table 1, footnotes 4–6 and Figures 5 and 9.
How Should You Read a Percentage Accuracy Specification?
Identify the denominator and every included error term before comparing percentages. A value stated as percent of full-scale span, percent of reading, percent of full-scale output or a combined formula can create very different absolute limits at the same operating point.
Consider two hypothetical 0–10 bar pressure sensors. One specifies ±0.25% of its 10 bar span; the other specifies ±0.25% of the reading, with no other terms in this simplified comparison.
Swipe horizontally to compare the error limits.
| Pressure reading | ±0.25% of 10 bar span | ±0.25% of reading | Span-based limit is... |
|---|---|---|---|
| 1 bar | ±0.025 bar | ±0.0025 bar | 10 times larger |
| 2 bar | ±0.025 bar | ±0.005 bar | 5 times larger |
| 10 bar | ±0.025 bar | ±0.025 bar | The same |
At 2 bar, selecting by “0.25%” alone would hide a fivefold difference in the stated limits. In real products, a reading-based expression may also include an offset, span term or digit count. Do not extrapolate it to zero error at zero input without checking the full formula.
Full scale also needs a definition. Full-scale span is the upper range value minus the lower range value. For −5 to +5 bar, that span is 10 bar, not 5 bar. Confirm what the manufacturer means by FS, FSS, full-scale output or rated range.
BFSL accuracy and total error band cover different effects
Honeywell's MIP documentation separates best-fit-straight-line (BFSL) accuracy from total error band. Its error diagram shows why offset, span and temperature-related effects cannot be assumed to be included in a smaller BFSL figure.
Selection consequence: ask which errors are included and over which conditions. Even a total error band is not automatically a guarantee for installation effects, every aging mechanism or the rest of your acquisition system. Do not add an error again if it is already inside the quoted band.
Source: Honeywell MIP high-pressure transducer datasheet, Figure 6.
How Do ADC Bits Translate into Real Measurement Resolution?
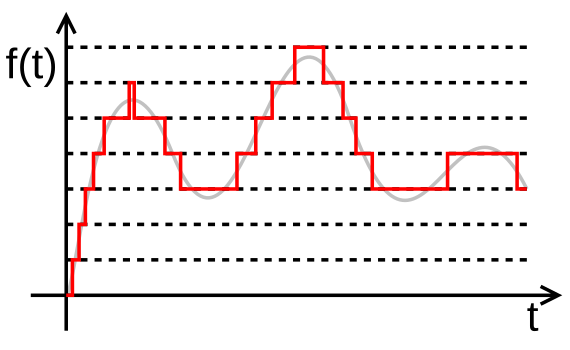
ADC bits define an ideal code step, not sensor or system accuracy. An analog-to-digital converter (ADC) turns a voltage into a digital code. An ideal N-bit ADC divides its input voltage span into 2N code bins. For a linear sensor, divide the voltage-bin width by the sensor's sensitivity to express one ideal step in pressure, temperature or distance units.
Ideal input step = voltage step ÷ sensor sensitivity
Use the actual signal swing
In an illustrative pressure circuit, a 0–10 bar sensor outputs 0.5–4.5 V into a 16-bit, 0–5 V ADC.
The sensor uses only 4 V of the ADC's 5 V span. Its sensitivity is 4 V ÷ 10 bar = 0.4 V/bar, so dividing 10 bar by all 65,536 bins would give the wrong input-step estimate.
- Ideal pressure step
- 0.191 mbar
- Assumed sensor error: ±0.5% span
- ±50 mbar
5 V ÷ 65,536 ÷ 0.4 V/bar, rounded.
A separate illustrative specification, not a measured result.
The one-sided 50 mbar error magnitude is about 262 ideal ADC steps. Those extra codes can still be useful for observing changes. They do not make the absolute error disappear.
Change the values for a linear pressure sensor. This tool compares an ideal code step with a separately assumed span-based error; it does not calculate measured noise, ENOB or total system accuracy.
- Ideal voltage step
- 76.294 µV
- Ideal pressure step
- 0.191 mbar
- Assumed sensor error
- ±50 mbar
- One-sided error magnitude / ideal step
- 262.144 steps
The signal uses 80% of the ADC input span. Sensitivity: 0.4 V/bar.
Assumptions: ideal uniform ADC bins, linear transfer, signal endpoints inside the ADC input limits, and no clipping. Results are rounded; very small values use scientific notation. Some datasheets use 2N − 1 for endpoint scaling; follow the device transfer function when converting actual codes.
A “24-bit” output word tells you the nominal code width. It does not establish 24 noise-free bits. For slow measurements, inspect noise-free resolution or effective resolution derived from the stated noise statistic. Dynamic effective number of bits (ENOB), usually derived from the signal-to-noise-and-distortion ratio (SINAD), is a different metric with different test conditions. Analog Devices explains these distinctions in its ADC input-noise tutorial.
What Sets Usable Resolution in a Real Measurement?
Usable resolution is the smallest change you can distinguish at the required speed and reliability. Noise, repeatability, filtering, bandwidth, hysteresis and sensor response time all matter. A finer output increment is useful only when these conditions leave enough signal margin.
Suppose a sensor reports to 0.001 mm, but fixed-input readings move around over a 0.02 mm range during the observation window. The last digit exists; that alone does not show reliable detection of a 0.001 mm movement. First separate real input motion from measurement noise.
For independent, equal-variance random noise around a stable mean, averaging M readings reduces the standard deviation of the mean by √M. Averaging 16 readings can therefore reduce that standard deviation by a factor of four. It does not remove a fixed bias, and correlated drift does not follow that simple improvement rule.
Analog Devices also notes that averaging identical ADC codes produces no extra information; noise reduction is not a cure for converter nonlinearity. See the averaging discussion.
- Define the changeHow small?State the smallest input change that matters to the process.
- Define the timingHow soon?State the allowed detection or settling time and the filter configuration.
- Define the evidenceHow reliably?Use repeated trials and a stated detection criterion, including false detections.
A stronger filter may stabilize a slow tank-level measurement but hide a short pressure event. Compare sensors at the bandwidth or response time the application actually needs, not with one heavily averaged and the other unfiltered.
Which Parts of the Measurement Chain Can Change the Result?
The sensor element is only one contributor. Mounting, mechanical alignment, thermal contact, wiring, signal conditioning, voltage reference, ADC behavior and software scaling can all change the result. The correct error budget follows the physical and software path from measurand to displayed or controlled value.

Fine digits cannot repair a poor fixture
For a displacement measurement, the complete path includes the target, contact or sensing geometry, mounting, transducer and readout. Verify that path in the intended configuration.
For a temperature measurement, ask whether you need the chip temperature, the air temperature or the temperature of a contacted surface. Those are not automatically equal.
A 0.001 mm readout does not establish a ±0.05 mm system
Assume three separate, non-overlapping maximum error contributions apply: ±0.04 mm from the sensor, ±0.01 mm from acquisition, and ±0.02 mm from installation.
= ±0.07 mm
This budget does not demonstrate compliance with a ±0.05 mm requirement. Adding display digits changes none of those assumed bounds. The next step is to reduce or better characterize the contributors, then validate the system.
Do not mix error limits with standard uncertainties. A conservative sum of applicable maximum bounds is not the same as an uncertainty calculation. NIST TN 1297 combines standard uncertainties using a measurement model, including covariance where relevant. Taking the root-sum-square of arbitrary maximum limits does not create a guaranteed system-error bound.
Also check for overlap. If a specification already includes the ADC or temperature effects, adding those same effects again can double-count the error.
How Can You Verify Accuracy and Small-Change Detection Before Approval?
Define the pass/fail decision first, then test the complete sensor and acquisition chain at the required points, speed and environment. An acceptance test for an absolute temperature limit is not the same as a test for detecting a small pressure change within 100 ms.
- Define the job in engineering units.Record the operating range, allowable measurement error, smallest meaningful change, response time and environmental conditions.
- Establish the reference and setup.Use a suitable reference with documented uncertainty. Control mounting, wiring, warm-up, supply and software scaling. Record the complete configuration.
- Test several working points.Include points near critical operating thresholds, not only the middle of the range. Compare readings after the defined settling time.
- Separate repeatability from hysteresis.Repeat fixed-input measurements, recording sample count and filter settings. Then approach the same points from increasing and decreasing inputs to reveal direction-dependent behavior.
- Test small changes and timing together.Apply controlled steps around the operating point. Use a predefined detection criterion and repeated trials to distinguish genuine changes from noise.
- Repeat under relevant conditions.Check the temperature, speed, mounting or supply changes that the application will encounter. Keep the results and conditions with the approved part number.
Calibration is not the same as adjustment
Calibration establishes a relationship between reference values and indications, with associated uncertainties. Adjustment changes the instrument. Applying a correction can reduce a known bias, but leaves residual uncertainty and does not automatically improve resolution.
One correct reading after a zero adjustment does not verify gain, nonlinearity, hysteresis or temperature behavior elsewhere. For measurements near an acceptance boundary, agree how uncertainty will be handled in the pass/fail decision before testing.
Swipe horizontally to see likely causes and checks.
| Observed symptom | Possible causes | Useful next check |
|---|---|---|
| Stable reading, consistently off | Offset, wrong scaling, reference mismatch or installation bias. | Compare several reference points and inspect the transfer conversion. |
| Reading fluctuates at a fixed input | Noise, interference, unstable supply or real input variation. | Verify input stability; compare raw and filtered readings. |
| Static result is good; short events are missed | Sensor lag, long averaging window or slow acquisition. | Apply a timed input step and measure response. |
| Different result on the way up and down | Hysteresis, backlash or changing contact conditions. | Repeat controlled increasing/decreasing cycles. |
| Correct at calibration point, wrong elsewhere | Gain error, nonlinearity or changed operating conditions. | Check multiple points and relevant temperatures. |
What Should a Sensor RFQ Specify Before You Compare Parts?
State the measurement decision, error basis, smallest meaningful change, timing and operating conditions. Give suppliers enough information to compare parts on the same basis. A request for “a high-resolution sensor” leaves the most important acceptance conditions undefined.
- Measurement: quantity, medium or target, working range, overload and critical operating points.
- Error requirement: absolute units or a defined percentage basis, maximum versus typical values, and operating temperature.
- Change detection: smallest meaningful change, required detection time, bandwidth and allowed filtering.
- Repeatability: the requested statistic and the conditions for comparing results.
- Integration: interface, supply, package, mounting, mechanical constraints and environmental protection.
- Evidence: current datasheet revision, calibration requirements, traceability documents and agreed acceptance testing.
- Ordering: full manufacturer part number, suffixes, approved alternatives and any configuration that affects performance.
“We are evaluating a pressure measurement for a 0–10 bar range, mainly operating at 1–3 bar. Please provide maximum error limits in bar over our stated temperature range, identify included error terms, and state noise or repeatability at the required response time. Include the exact ordering code, output transfer function, filter options and calibration documentation.”
For incoming-part documentation and sourcing requirements, see YURUNOX's quality assurance information. For manufacturer-specific inquiries, start with Texas Instruments components, Analog Devices components or Honeywell components.
Share the manufacturer part number, datasheet revision, quantity, operating range, error basis, smallest meaningful change, response time, environment, approved alternatives and required date. These inputs let YURUNOX start the sourcing inquiry with the technical constraints engineering must verify.
YURUNOX is an electronic-component sourcing partner. Technical equivalence and system performance require engineering review and validation.
Which Primary Sources Define These Accuracy and Resolution Claims?
Published product examples above come from manufacturer documents, not YURUNOX test results. Worked pressure, temperature and displacement scenarios are explicitly illustrative.
- JCGM / BIPM: International Vocabulary of MetrologyDefinitions of accuracy, resolution, precision, repeatability, sensitivity and calibration are linked beside the relevant explanations.
- Texas Instruments: TMP117 datasheet, Rev. DSection 6.5 separates the temperature code increment from error limits and test conditions.
- Sensirion: SHT4x datasheet, version 7.3, June 2026Table 1 and humidity accuracy curves; numerical repeatability definition in the footnotes.
- Honeywell: MIP series high-pressure transducer datasheetFigure 6 explains error contributions and the distinction between BFSL accuracy and total error band.
- Analog Devices: ADC Input Noise: The Good, The Bad, and The UglyWalt Kester's explanation of ADC noise, resolution terminology and averaging.
- NIST TN 1297: Combined Standard UncertaintyCombining standard uncertainties, including relevant covariance terms.
Image credits and licenses appear with each figure. Consult the applicable datasheet revision for the exact ordering code and operating conditions.